作为一名”懒惰”的程序员,如何避免在线上Golang系统半夜宕机 (一般是OOM导致的)时起床保存现场呢?又或者如何dump压测时性能尖刺时刻的profile文件呢? holmes 或许能帮助您解决以上问题。
holmes性能指标监控
holmes是什么?
对于系统的性能尖刺问题,我们通常使用 Go 官方内置的 pprof 包进行分析,但是难点是对于一闪而过的“尖刺”,

开发人员很难及时保存现场:当你收到告警信息,从被窝中爬起来,打开电脑链接 VPN,系统说不定都已经重启三四趟了。

MOSN 社区的 Holmes 是一个基于 Golang 实现的轻量级性能监控系统,当应用的性能指标发生了异常波动时,

Holmes 会在第一时间保留现场,让你第二天上班可以一边做着大保健,一边追查问题的根因。
快速入门
package main

import (
	"fmt"
	"mosn.io/holmes"
	"mosn.io/pkg/log"
	"net/http"
	"time"
)

func init() {
	http.HandleFunc("/make1gb", make1gbslice)
	go http.ListenAndServe(":10003", nil)
}

var grReportCount int
var cpuReportCount int
var memReportCount int

type ReporterImpl struct{}

func (r *ReporterImpl) Report(pType string, buf []byte, reason string, eventID string) error {
	fmt.Println(fmt.Sprintf("call %s report \n", pType))

	switch pType {
	case "goroutine":
		grReportCount++
	case "cpu":
		cpuReportCount++
	case "mem":
		memReportCount++

	}
	fmt.Println("type=", pType, "reason=", reason, "eventid=", eventID)
	fmt.Println("content =", string(buf))
	return nil

}
func main() {
	r := &ReporterImpl{} // a implement of holmes.ProfileReporter Interface.

	h, _ := holmes.New(
		holmes.WithProfileReporter(r),
		holmes.WithCollectInterval("2s"),
		holmes.WithDumpPath("/tmp/holmes"),
		//holmes.WithTextDump(),
		holmes.WithMemDump(3, 25, 80, time.Minute),
		holmes.WithCPUDump(1, 25, 80, time.Minute),
		holmes.WithGCHeapDump(10, 20, 40, time.Minute),
		holmes.WithGoroutineDump(5, 25, 20000, 0, time.Minute),
		holmes.WithLogger(holmes.NewFileLog("/tmp/holmes/holmes.log", log.ERROR)),
	)

	h.EnableCPUDump().
		EnableGoroutineDump().
		EnableMemDump().
		EnableGCHeapDump().Start()
	time.Sleep(time.Hour)

}

func make1gbslice(wr http.ResponseWriter, req *http.Request) {

	var a = make([]byte, 1073741824)
	_ = a
}
上面的代码是用来监控内存指标,超过咱们设置的规则,就会dump,并报警!
然后执行上面的代码,这样服务就被监控起来了,哈哈哈。

访问这个接口
http://127.0.0.1:10003/make1gb

你会发现在tmp/holmes目录下有个
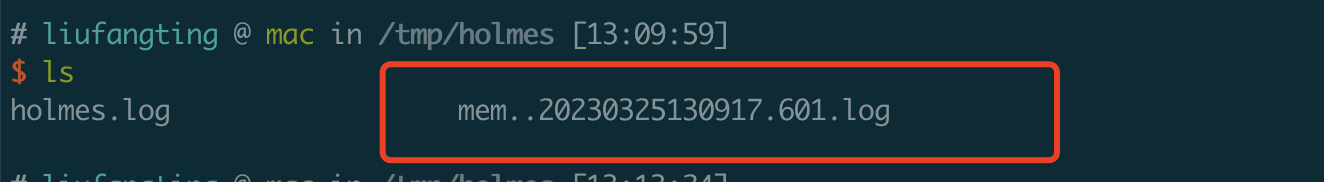
咱们现在进入该文件所在目录,开始分析这个文件
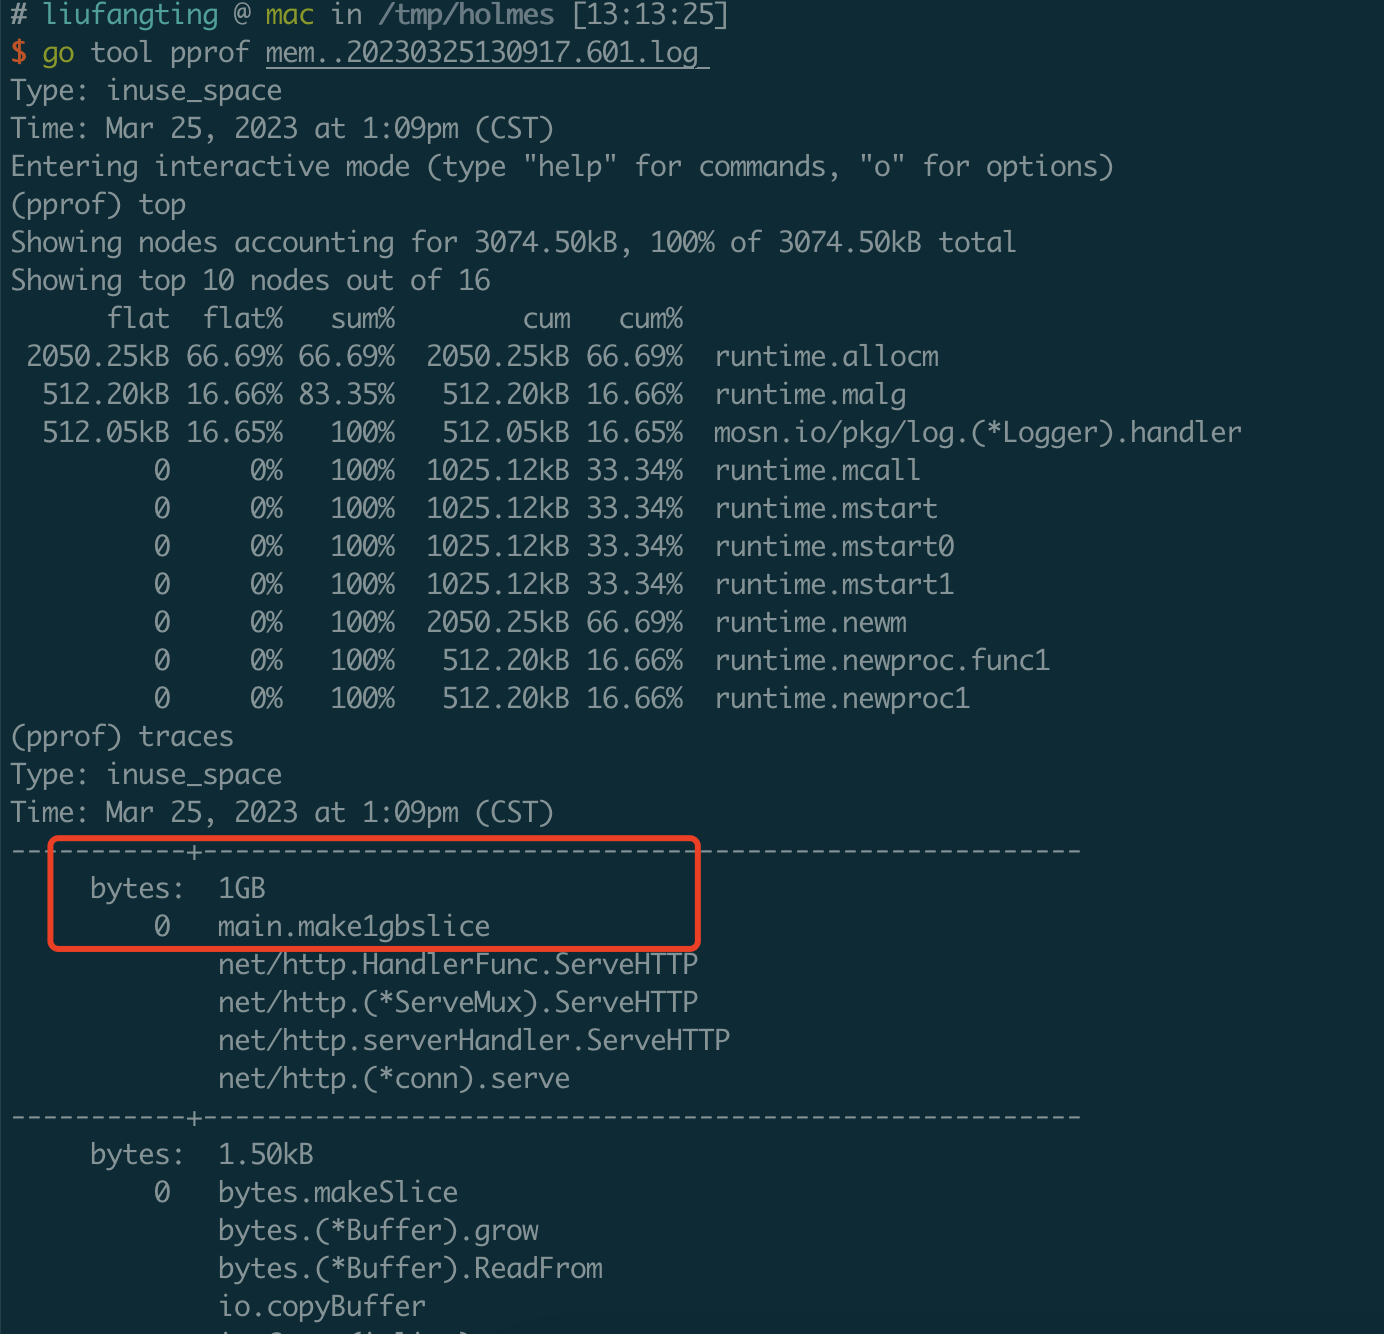
go tool pprof mem..20230325130917.601.log
使用 traces 就能很快找到内存泄漏的代码是哪一个,如下图所示
二、使用说明
类似于 holmes.WithGoroutineDump(min, diff, abs,max,2 * time.Minute) 的 API
每个 Profile 都可以配置 min、diff、abs、coolDown 四个指标,含义如下:

当前指标小于 min 时,不视为异常。

当前指标大于 (100+diff)100% 历史指标,说明系统此时产生了波动,视为异常。

当前指标大于 abs (绝对值)时,视为异常。

CPU 和 Goroutine 这两个 Profile 类型提供 Max 参数配置,基于以下考虑:

CPU 的 Profiling 操作大约会有 5% 的性能损耗,所以当在 CPU 过高时,不应当进行 Profiling 操作,否则会拖垮系统。

当 Goroutine 数过大时,Goroutine Dump 操作成本很高,会进行 STW 操作,从而拖垮系统。(详情见文末参考文章)
三、Profile Types
Holmes 支持以下五种 Profile 类型,用户可以按需配置。

Mem: 内存分配

CPU: CPU 使用率

Thread: 线程数

Goroutine: 协程数

GCHeap: 基于 GC 周期监控的内存分配
四、Warming up
当 Holmes 启动时,会根据 CollectInterval 周期采集十次各项指标,在这期间内采集到的指标只会存入循环链表中,不会进行规则判断。
五、事件上报
您可以通过实现 Reporter 来实现以下功能:

发送告警信息,当 Holmes 触发 Dump 操作时。

将 Profiles 上传到其他地方,以防实例被销毁,从而导致 Profile 丢失,或进行分析。
type ReporterImpl struct{}
        func (r *ReporterImple) Report(pType string, buf []byte, reason string, eventID string) error{
            // do something
        }
        ......
        r := &ReporterImpl{} // a implement of holmes.ProfileReporter Interface.
      h, _ := holmes.New(
            holmes.WithProfileReporter(reporter),
            holmes.WithDumpPath("/tmp"),
            holmes.WithLogger(holmes.NewFileLog("/tmp/holmes.log", mlog.INFO)),
            holmes.WithBinaryDump(),
            holmes.WithMemoryLimit(100*1024*1024), // 100MB
            holmes.WithGCHeapDump(10, 20, 40, time.Minute),
)
参考资料
[1]《Holmes 文档》https://github.com/mosn/holmes

[2]《无人值守的自动 dump(一)》https://xargin.com/autodumper-for-go/

[3]《无人值守的自动 dump(二)》https://xargin.com/autodumper-for-go-ii/

[4]《go 语言 pprof heap profile 实现机制》https://uncledou.site/2022/go-pprof-heap/

[5]《goroutines pprofiling STW》https://github.com/golang/go/issues/33250

[6]《Holmes 使用案例文档》https://github.com/mosn/holmes/tree/master/example

[7]《go pprof 性能损耗》https://medium.com/google-cloud/continuous-profiling-of-go-programs-96d4416af77b